In this article, we will explore the top 10 LMS reporting metrics essential for measuring your training programmes' success and improving their effectiveness. We cover each metric in detail and explain how to identify areas of improvement and drive better outcomes for your eLearning business.
LMS reporting refers to the process of collecting, analysing, and presenting data from a Learning Management System (LMS). Through reviewing LMS reports, you can reveal insights into various aspects of the learning process, such as learner progress, course engagement, and training effectiveness, enabling educators and administrators to make informed decisions and improve the overall learning experience. t insights into various aspects of the learning process, such as learner progress, course engagement, and training effectiveness, enabling educators and administrators to make informed decisions and improve the overall learning experience.
Whether you're a learning and development professional, a trainer or a business owner, this article will provide the knowledge and tools you'd need to track and understand various LMS reporting metrics to make data-driven decisions.
LMS reporting is an essential tool for tracking and optimising training programmes. By analysing LMS reporting metrics, you can gain valuable insights into your training programmes' effectiveness and identify improvement areas. Equipped with this data, you can make data-driven decisions on the following topics:

In order to optimise LMS reporting and extract the most valuable insights, it is crucial to adhere to certain best practices. First and foremost, establish clear objectives for your reporting needs. This will help you identify the most relevant metrics and data points to track. Consistently update and maintain the data within the system, ensuring the accuracy and reliability of the reports generated. Customise reports based on the intended audience, whether it be course instructors, administrators or students, to provide the most pertinent information. Lastly, schedule regular reviews of the reports to monitor progress and make data-driven decisions for continuous improvement.
The enrollment rate is a metric that measures the percentage of learners who have enrolled in a particular training program as a portion of your total visitors. This metric can provide insights into your training programs' popularity and perceived value.
By tracking enrollment rates, you can identify which training programs are most popular and which may need more promotion. Low enrollment rates can also be a sign that the training program is not meeting the needs of the learners. As it is with many things in life, sticking to a balance between your marketing and course content is very important. Spending too much on either could have a negative impact on your enrolment rate.
To improve enrollment rates, you can use strategies such as:
Course completion rates refer to the percentage of learners who complete the course or training program. It is an essential metric for measuring the overall success of your training programs.
Measuring course completion rates through the reporting dashboard allows you to identify areas where learners drop off. For example, if learners consistently drop out of a particular module, the content could be too difficult or not engaging.
To improve course completion rates, you can use strategies such as:
Time to completion is another critical LMS reporting metric measuring learners' time to complete a training program. The longer the time to completion, the more chances for learners to lose motivation and drop out.
Using LMS reporting to track time to completion can help you identify areas where learners may be struggling. Use this information to improve the training program. This can be done by simplifying the content or breaking it into smaller, more manageable chunks (Drip feeding can help!).
Here are some strategies that can help reduce time to completion:
It is important to note that reducing time to completion should not come at the expense of quality or effectiveness.

ROI metrics refer to the return on investment of your training programs. It includes the revenue gained from selling your courses divided by the total cost of training for your learners.
Measuring ROI metrics allows you to determine the effectiveness of your programs and make data-driven decisions about future investments.
To improve ROI metrics, you can use strategies such as:
Improving ROI metrics demonstrates the value of your training programs to stakeholders. It ensures that future investments are targeted and effective in meeting the needs of the business.
Engagement metrics refer to learners' level of interaction and participation with the course content. It includes metrics such as time spent on each module, number of logins, and course ratings.
Measuring engagement metrics through LMS reporting provides insights into how learners are engaging with the material and where improvements can be made. For example, if learners are spending less time on a particular module, it may indicate that the content is not relevant or engaging enough.
To increase learner engagement, you can use strategies such as:
Assessment scores refer to the scores achieved by learners on quizzes, tests, and practical assessments. It is an essential metric for measuring the effectiveness of your training programs, as it indicates the level of understanding and retention of the course content.
Measuring assessment scores through custom reporting allows you to identify areas where learners are struggling and where improvements can be made. For example, if learners are consistently scoring low on a particular quiz, it may indicate that the content is too complex or not explained adequately.
To improve assessment scores, you can use strategies such as:
Feedback from learners is a crucial component of any training program. By using LMS reporting metrics, you can monitor and evaluate learner feedback and survey results to gain valuable insights. For example, how your learners are responding to your courses. Additionally, through this, you can pinpoint areas where your training program may be lacking and make the necessary adjustments to enhance the overall learning experience. Some of the key feedback and survey metrics you may want to track include the following:
User activity metrics provide a detailed view of how learners are engaging with your training program. By tracking user activity, you can identify which courses are the most popular, active learners and courses in need of improvement. Some of the key user activity metrics you may want to track include:
Competency metrics can help you evaluate how well your learners are mastering specific skills or competencies. By using competency metrics, you can pinpoint areas where learners are experiencing difficulty and modify your training program. Some of the key competency metrics you may want to track include:
The repeat participation rate measures the percentage of learners who have repeated a specific course or training program. After all, this metric reveals the effectiveness of the course content and delivery and learner engagement. Additionally, high rates indicate value and engagement, while low rates signal areas that require improvement. Moreover, this metric can help identify potential knowledge gaps or areas where learners may need additional support or resources.
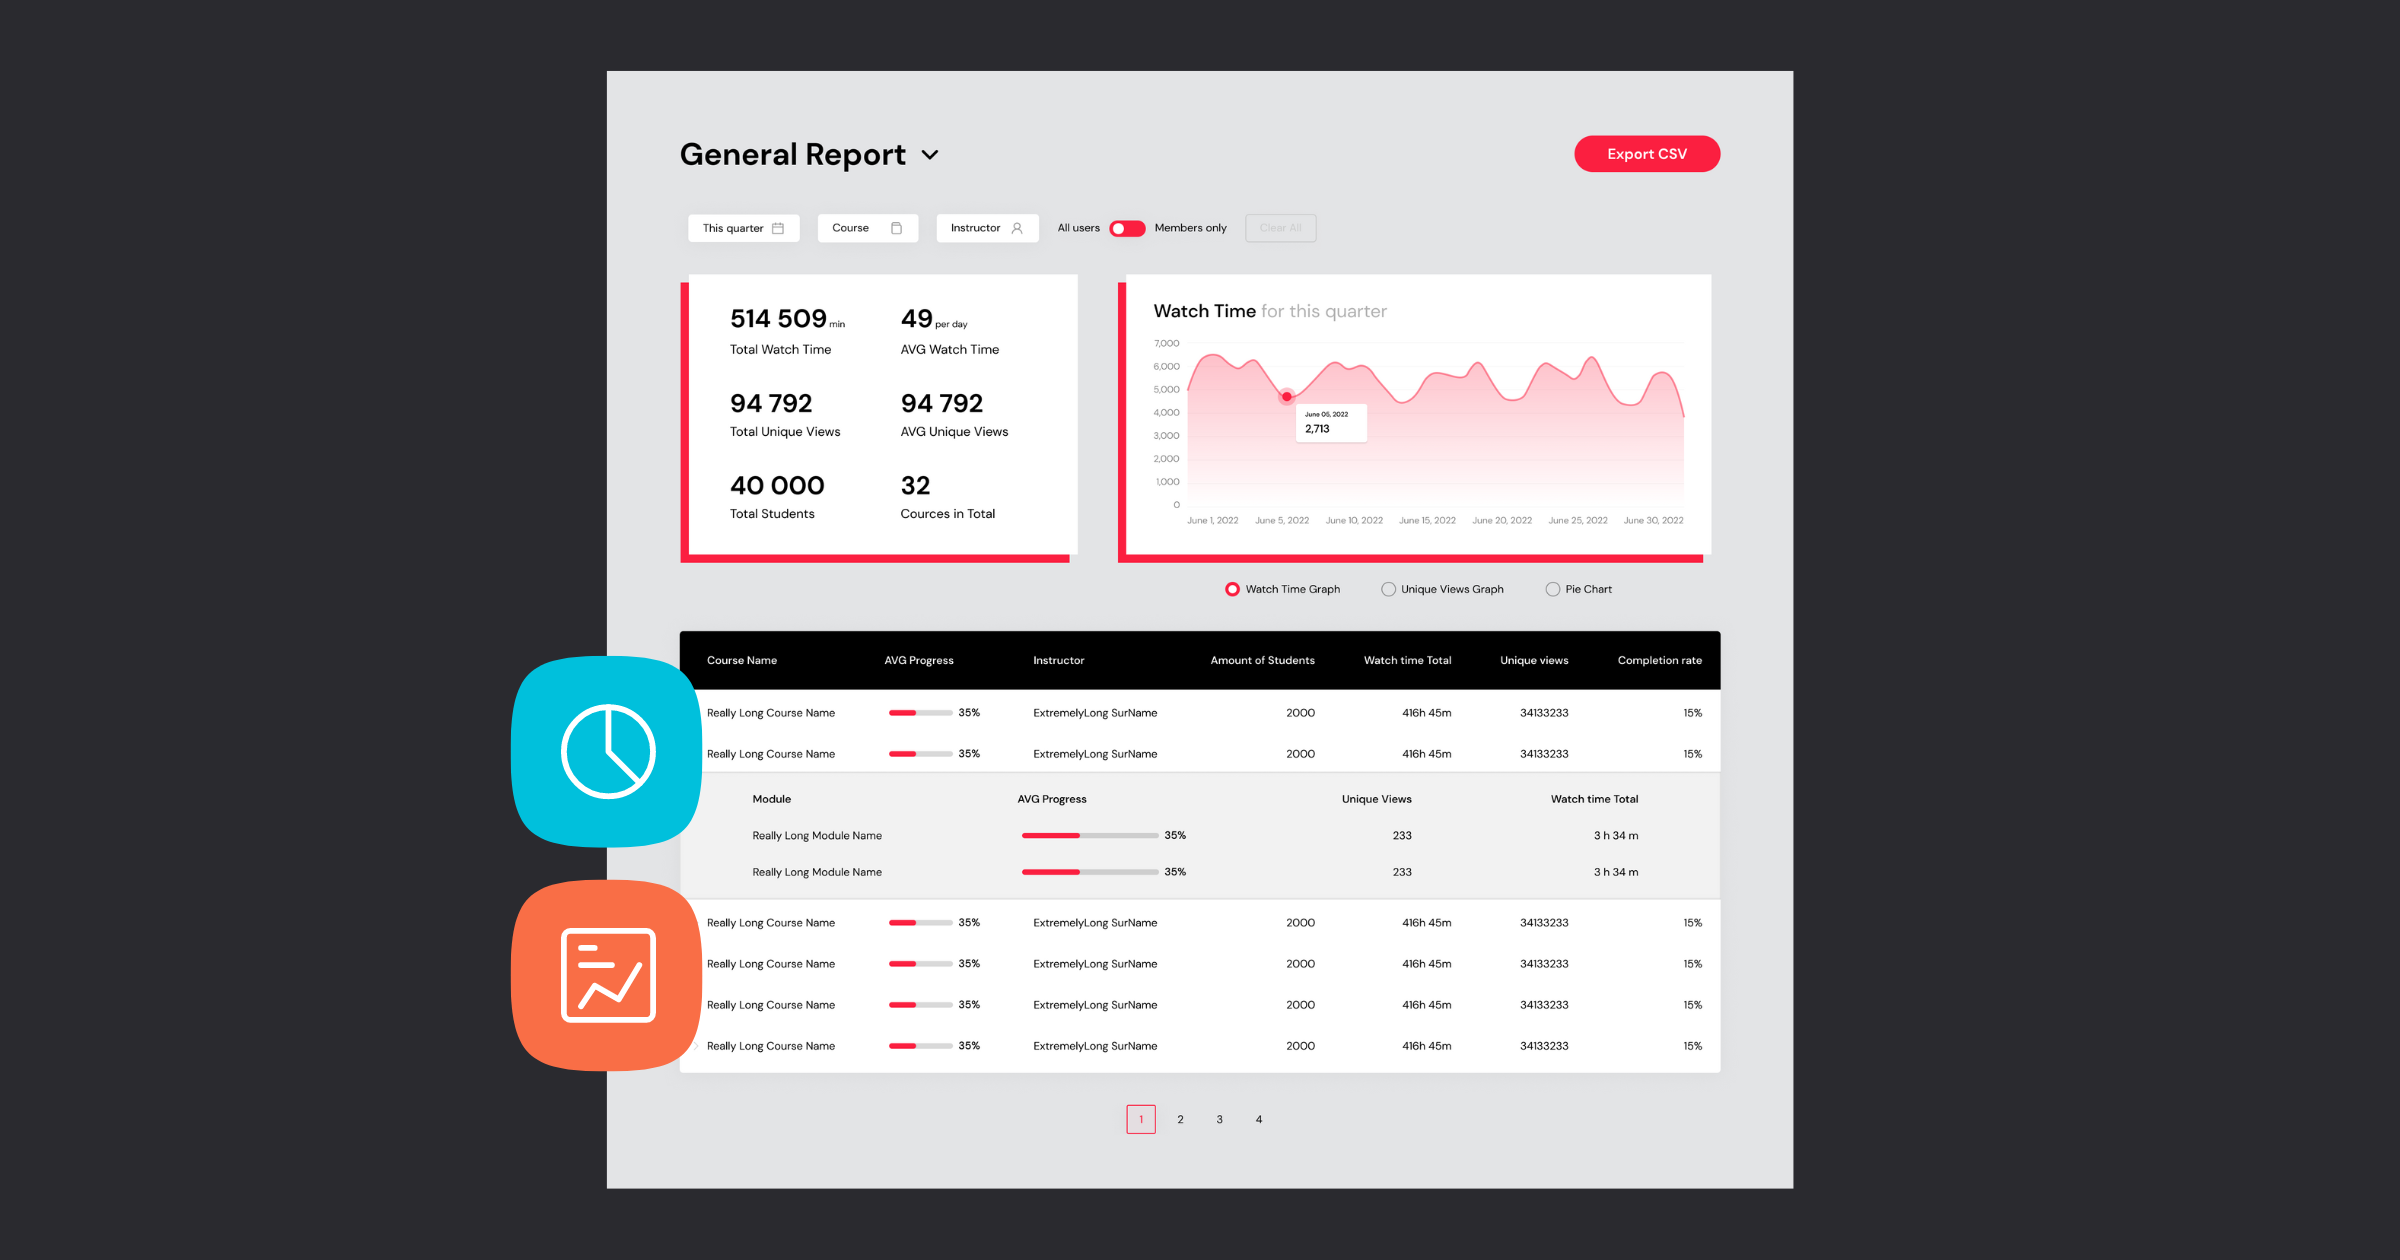
Now that you are aware of the metrics to monitor and how to enhance your training programme, you may be wondering which tools to employ for tracking those significant indicators. However, let me be forthright and say that we have not encountered any tool that can effectively monitor all those metrics and provide valuable insights. Every tool has certain constraints, which compelled us to create our own customised LMS Analytic tool. It is a fully personalised reporting dashboard that enables you to customise the reporting as per your specific needs.
👉Slow LMS? We wrote a comprehensive guide on how to speed things up!
In conclusion, LMS reporting metrics provide valuable insights into the effectiveness of your training programs and enable you to make data-driven decisions to optimise them for better outcomes. From learner engagement to ROI, each metric can help you identify areas of improvement and tailor your training programs to meet the needs of individual learners and the organisation.
By regularly monitoring and analysing LMS reporting metrics, you can identify trends and patterns, recognise issues early on, and develop strategies to address them. This will enhance the effectiveness of your training programs and demonstrate the value of learning and development to stakeholders.
In summary, by leveraging the power of LMS reporting metrics, you can create more engaging, relevant, and effective training programs that drive better outcomes for both learners and the organisation.

